
6.2 Expected future market returns and risks

Article 6.1 assessed asset classes based exclusively on the history of returns and risks. You have probably seen the disclaimer on financial websites that “past performance is no guarantee of future results”. While we learn history in part to avoid repeating past mistakes, our decisions must also consider whether any particular historical mistakes are even relevant to our current situation. After all, no historical period is exactly like right now.
[Note that this article is updated periodically to include the most recent return forecasts from various sources. The data in this article were last updated in September of 2021.]
Expected future market returns: stocks and bonds
The returns picture is not pretty for the near future. You can find all sorts of predictions of expected future returns based on various calculations and models. Unfortunately, most of these predictions point to stock and bond returns in the next few years that are below historical averages.
I reviewed multiple websites and news articles in September of 2021 for possible sources of return forecasts from reputable investment companies. I’m sure my resulting database is not exhaustive, but I didn’t find any more comprehensive summary on the internet. This table summarizes the forecasts of nominal (not inflation-adjusted) annual returns for the next 7 to 15 years.
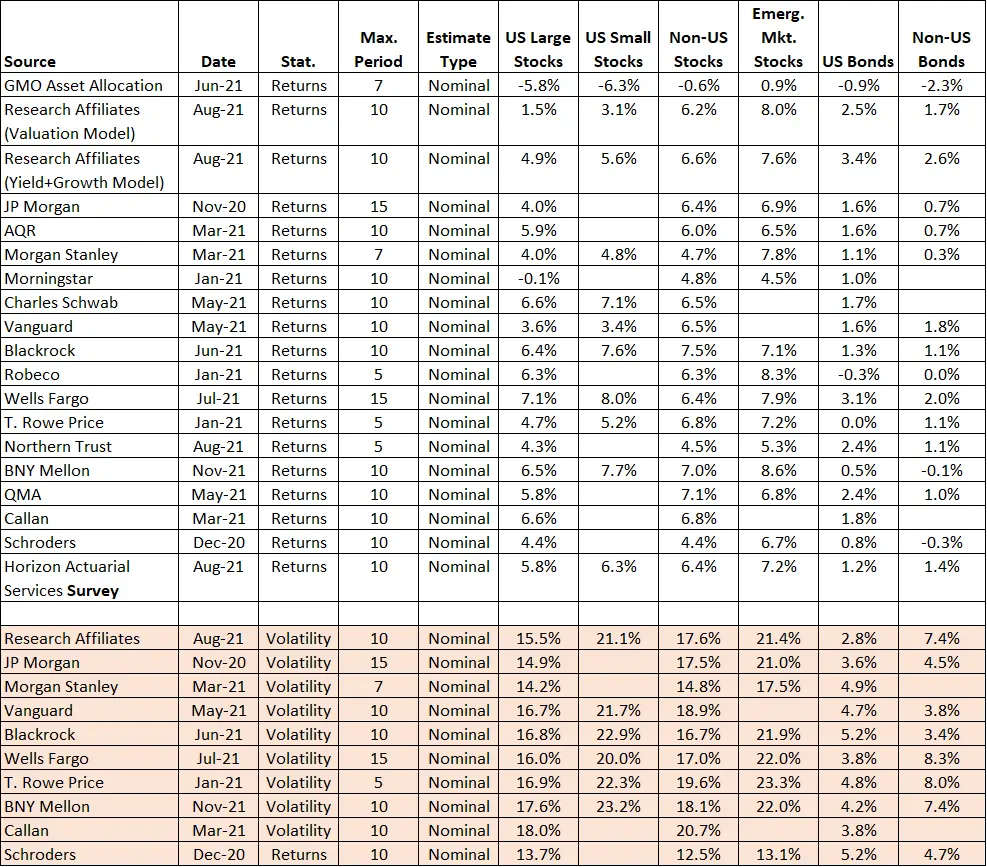
The tan-colored bottom rows of the table show volatility (standard deviation) estimates that were also available from several of these sources. I’ll discuss these volatility estimates more in the “risk” sections below. The table shows that professional investors are assuming U.S. stock returns in the next 7 to 15 years will be somewhere between -6% to 8%, well below the long-term historical average of 9%. However, most (but not all) professionals are still expecting that stocks will provide at least twice the returns of bonds.
Here’s a graph that shows the ranges of the return forecasts by asset type.

The pink line highlights the results of a forecast survey of investment firms by Horizon Actuarial Services. The Horizon survey provides an overall average of the return forecasts from 39 firms, which includes some, but not all of the individual forecasts shown independently above.
Most of these forecasts expect that international stocks (both developed and emerging markets) will outperform U.S. large-cap stocks. Conversely, U.S. government bonds are generally expected to keep pace with or slightly outperform international government bonds. As highlighted by the red line, GMO’s forecasts are particularly sobering given they forecast near zero or negative returns for every asset type except emerging markets. However, GMO is famous for publishing perennially bearish return predictions.
The above summary focuses on one overall central tendency estimate (like an average). However, some of these studies examined the uncertainties of their return forecasts. Research Affiliates (RA) provided specific uncertainty values for their yield and growth model. And as shown in this graph, Vanguard estimated the 25th and 75th percentile bands around their forecasts for the 60/40 stock/bond portfolio (top), U.S. stocks (bottom left), and Non-U.S. stocks (bottom right).

These graphs show that Vanguard’s past estimates (and likely everyone else’s too) were way lower than the returns that actually occurred from 2011 to 2020. Looking ahead, if you consider that the 25th to 75th percentile covers only half of the possible outcomes, the range of reasonable future stock returns is quite large, which means these forecasts are highly uncertain.
These uncertainty estimates highlight that predicting the future is a notoriously uncertain activity. To highlight this point, Charlie Biello compared a previous GMO 7-year forecast to actual subsequent returns as summarized in this table.
| Previous GMO Return Forecast | Forecast | Actual | Difference |
| US Large Stocks | 2.7% | 13.2% | 10.5% |
| US Small Stocks | 0.1% | 12.0% | 11.9% |
| Non-US Stocks | 6.1% | 4.7% | -1.4% |
| Emerging Market Stocks | 7.6% | 0.7% | -6.9% |
| US Bonds | 2.8% | 2.5% | -0.3% |
| Non-US Bonds | 1.2% | 0.1% | -1.1% |
Again, the bond estimates turned out to be reasonably accurate, while most of the stock forecasts missed the target by a wide margin.
Expected future stock and bond market risks
As I mentioned above, several of these companies also provided forecasts of volatility (one measure of risk) in terms of standard deviation. We can see the combined return and volatility estimates using the classic cross-plot of risk versus return that I introduced in Article 6.1.

The colored ovals around the dots help show where the various asset classes are grouped. These companies are forecasting that bond volatilities will be in the 3% to 8% range, while stock volatilities will be in the 13% to 23% range. Both forecasts are similar to historical volatility estimates discussed in Article 6.1.
As I’ve noted before, the standard deviation by itself is only the first step in estimating the true risk of permanent loss. Nonetheless, it provides a consistent point of comparison that we should not expect stocks and bonds to be substantially more or less volatile in the near future, which eliminates one potential variable. Just like with predicting future returns, predicting future risks for any given period is a highly uncertain exercise, and these future risk estimates are just central tendencies. We should expect such risk forecasts to be wrong as often as the return forecasts. But they still represent the most likely estimated outcome based on the assumptions of the model used.
The future of bond market returns
Because bonds are particularly sensitive to interest rates and currently, interest rates are at historically low levels, many have suggested that bonds now have a return/risk profile that is substantially different from the past. Let’s examine whether there are any more fundamental concerns with bond investing right now beyond simple return/risk metrics. First, we have to understand how bonds produce positive returns.
Where do bond returns come from? – As I already mentioned, the expected future return on bonds is likely to be minimal at best, with the central tendency estimate at perhaps 2% before inflation. Why are bond returns expected to be so bad? Most of the return from bonds comes from the interest income paid, or the bond’s yield (as opposed to changes in bond prices), as illustrated in this chart from NewFound Research. (Note that NewFound took down this particular graph, but I’ve provided a link to a similar article by them.)

The interest income paid by a bond is determined mostly by prevailing interest rates for loans in general. No one is going to buy a 10-year bond that yields only 1% if instead they could loan that money out elsewhere for a similar period and get 3% interest. Bond issuers must keep pace with the prevailing interest rates if they expect people to purchase those bonds.
History of interest rates – What does the history of interest rates tell us about the current and future environment for bonds? This graph, also from Newfound Research, shows 10-year U.S. Treasury bond rates (which reflect interest rates in general) since 1875.

The orange circle on the right highlights that interest rates in 2015 were already at truly historic lows. And now they are even lower, with the 10-year bond yield currently at 0.66% as of September 2020! Merrill Lynch conducted an analysis that reached back to the invention of money itself 5000 years ago. As shown in the chart below, the current interest rates are nearly unique across all history, which means that future bond returns will be uniquely low as well.

For several years now, some countries in Europe and Japan have been issuing intermediate-term bonds with negative interest rates to stimulate their economies. A negative rate paradoxically means that the bond issuer gets paid income from the bond purchaser. However, this is not an investment “opportunity” that many will want to pursue, for obvious reasons. So, sustained and substantial negative interest rates are not likely, and if they were, it would mean that such bonds only have value if rates continue to move even further into negative territory. This would be a questionable long-term investing approach for the individual investor.
Future of bond rates – It would be logical to assume that because interest rates have no place to go but up, bonds will soon recover to their former historical rates of return. The problem is almost no one is predicting a rapid rise in interest rates, and the U.S. Federal Reserve System (the Fed) is expecting to keep base interest rates at zero for the foreseeable future.
The Fed has also been clear that the pace of any interest rate increases is highly dependent on the health of the economy. If the economy starts to grow very fast and inflation starts to pick up, then interest rates may need to rise higher or more quickly. But almost no one is predicting a fast-growing economy. Inflation did pickup in 2020 and so far in 2021, but the Fed is indicating they expect this inflation spike to be transitory. As a result, Robert Shiller, an often prescient Nobel economist, has warned of the “New Normal”, which is continued historically low interest rates and yields for some time to come.
Let’s assume that the economy and inflation pick up some and the Fed adds a percent or two to the existing 10-year bond yields in the next few years. A two percent increase would put the current (September 2021) yield for a 10-year bond at about 3.6%. But that is still a quite low yield for such bonds by historical standards. So, all expectations are that bond returns will continue to be very low. Like any prediction, there is considerable uncertainty around this estimate, but again, it appears to be the most likely scenario.
Future of bond prices – There is another problem with the current low bond yields. When bond yields go up, bond prices go down. This relationship is explained more here. Even though most of the return from bonds comes in the form of interest income, decreasing bond prices still take a bite out of those returns. As a general rule-of-thumb, for every percent increase in interest rates, there will be a 1% decrease in the bond price for each year of bond duration. So, if interest rates rise by 1%, the price of a 10-year bond will go down by about 10%. The Wall Street Journal presented a bond price calculator using a more precise algorithm. That calculator provides the following price declines for the 10-year US bond, which yields about 1.5% as of October 2021:
- 1% yield increase = 9% price decrease
- 2% yield increase = 16% price decrease
- 3% yield increase = 23% price decrease
A 2% yield increase in the next five years appears entirely possible, and the net effect would be pretty dismal. For example, if you purchased a 10-year bond fund, and the yield of that fund goes from about 2% to 4% in the next 5 years and the price goes down 16% in those same 5 years, your net annualized return over 10 years will be only about 1.7%. (This estimate assumes no reinvestment of interest payments and that neither the yield nor the price of the fund changes further in years 6 through 10.) If you adjust this annualized return for an equally plausible 2% rate of annual inflation, you are actually losing spending power (negative real returns).
My one example here is consistent with other’s observations about the range of possible future outcomes for bonds. Cullen Roche examined the “worst case” for bonds and noted that “…interest rates rose from 2% to 15% from 1940-1980 and that the 10-year U.S. government bond generated an average annual return of 2.85%.” However, like my example, the average annual inflation over this same period was 4.5%. Again, the inflation-adjusted bond returns were negative in this period.
These examples are also consistent with a study conducted by Research Affiliates. As shown in this graph using the 10-year U.S. government bond, historically there has been a nearly one-to-one relationship between the starting bond yield and the subsequent total bond returns in the next 10 years.

So, even allowing for the difficulties of predicting future interest rate changes, history suggests that low bond yields today are likely to provide low returns in the future. Applying today’s (October 2021) 10-year bond yield of about 1.5% to the above graph, we should expect the 10-year nominal return on such a bond fund to be about the same.
Ideas for mitigating bond investing – There is a pretty constant stream of media articles nowadays pointing out ways to partially avoid some of the current problems with bonds. Let’s review some of the more popular suggestions one at a time.
- If you buy actual bonds, not bond funds, and hold them to maturity, you get back the face value on the bond with no price decrease. However, if you need to invest now, that strategy just gets you back to the historically very low return provided by the bond yield only (no potential price increases). For example, if you buy an actual 10-year U.S. Treasury bond (not a bond fund) as of September 2020, you are locking in an approximate 0.7% annual return for the next 10 years on that money. Given inflation is expected to be around 2%, you are essentially guaranteeing that your bond purchase won’t maintain spending power over the next 10 years. That’s a pretty long time frame to virtually guarantee no real return.
- Another way to mitigate bond price declines is to favor shorter-term bonds because longer-term bonds suffer greater price declines when interest rates rise. Using our rule-of-thumb from above, when interest rates rise by 1%, the price of a 2-year bond will decline by about 2%, but the price of a 10-year bond will decline by about 10%. Although the rule-of-thumb starts to break down a bit with long-duration bonds, price declines in the 20% to 25% range are possible for 30-year bonds when interest rates rise just 1%. These steep price declines sound more like the risks typically associated with stock market crises. Top bond investors like Bill Gross have been shouting warnings for years against holding long-duration bonds. Cullen Roche and others suggest that the sweet spot for bond duration is an intermediate duration around the 7-year mark. This provides a balance point of somewhat higher yields with somewhat lower price sensitivity. However, as shown in the above examples using 10-year bonds (a close neighbor to a 7-year bond), intermediate duration bonds will most likely give you about a 0.7% annual return for the next 10 years regardless of whether you hold a bond fund or an actual bond for this period. And less likely scenarios won’t do much better. A rapid increase in interest rates, like that seen in 1940 to 1980 example above, would likely only get you up to about a 2% annual return. Likewise, continued low and flat rates will keep returns down in the 1% range for bonds with durations less than 20 years.
- Another mitigation strategy is to buy a series of bonds with increasing durations (like 2, 4, 6, 8, and 10-year bonds) in something called a bond ladder. As the shorter-term bonds mature, and presumably interest rates have gone up, you can apply the short-term cash to longer-term bonds at higher interest rates. I could go into a huge tangent here about bond ladders. Suffice it to say that if you don’t expect interest rates to rise very rapidly, and even if you hold actual bonds to maturity (not a bond fund), you are still fiddling with returns in the few percent range. For example, as of September 2020, the rates on 2 to 10-year government bonds range from only about 0.1% to 0.7%. So, unless interest rates take off in the next few years, your bond ladder is still unlikely to outpace inflation. If you are interested, here are a few choice thoughts about some of the issues with bond ladders.
- One final mitigation strategy often mentioned involves a specific type of bond called Treasury Inflation-Protected Securities (TIPS), which provides yields that are expressly augmented based on inflation. (Because TIPS are linked to the time-dependent factor of inflation, I will come back to this option in Article 8.3, which is about investing over time.) However, Rick Ferri points out in “All About Asset Allocation” that TIPS are not the free lunch they might initially appear to be. He says, “Before you get too excited about the inflation-adjustment features of TIPS, you should understand that all bonds already have an inflation forecast built into their expected return.” For example, as of September 2020, the traditional 10-year government bond is yielding about 0.7% and the 10-year TIPS yield is negative 0.9%, with the difference being investors’ collective inflation expectation (1.6%). You’ll note that this investor-expected inflation rate is about the same as the 2% government forecast I noted previously. So, TIPS might provide a return nearly the same as the traditional 10-year bond. But that depends on where inflation heads in the next few years. TIPS can be a good hedge against unexpected rapid rises in inflation, which have occurred periodically in the past. But as already discussed, most people are not expecting rapid inflation soon.
While we can quibble about details that might moderately boost bond returns, all of these approaches likely result in inflation-adjusted returns that hover around zero. Further, some of these bond scenarios are both more complex to implement and not significantly different from simply holding cash. The best bank savings accounts currently (October 2021) pay about 0.6% interest annually.
Timing the bond market? – As a bit of a preview, Article 8.5 discusses that attempting to “time the market” by buying and selling stocks as the market goes up and down is not a particularly mindful approach. So, isn’t avoiding bonds right now essentially a form of bond market timing? My short answer is, no. I think there is a fundamental difference between stocks and the current bond situation. Even when stocks get into bubble territory (extremely high valuations) as was seen in 2000 and to some extent in 2007, there is no practical reason why stock prices can’t go even higher. There can always be “greater fools” who are willing to buy the same stock at ever more inflated prices. And it is very hard to determine when stock prices are so inflated that the bubble is about to burst. The practical floor in bond rates is fundamentally different given there are very few fools who will want to invest in negative yields for the long term. While there is no ceiling in stocks, there is a floor in bond yields, and objectively and historically speaking, we’re lying on that floor right now.
Bond dangers – Even before bond yields reached the unprecedented lows of 2020, many investors were pointing out that bonds are more dangerous in a historically low rate environment:
- Burton Malkiel, author of Random Walk Down Wall Street, said he thinks bonds (and particularly bond funds) “may be one of the riskiest plays you can make”
- Ben Carlson pointed out that the unusually low bond yield environment may cause an increase in bond volatility in the future
- Brian Portnoy wrote an article on the painful lessons looming for those who are piling into bond index funds in the last few years.
It’s also worth pointing out that some knowledgeable investors, like Charles Ellis, have for many years questioned the value of the lower returns of bonds in a long-term portfolio. Consequently, a mindful perspective tells us we should be skeptical about the standard claims that a diversified portfolio needs to contain a balance of stocks and bonds, or at least we should be skeptical that bonds need to represent a substantial proportion of that balance at all times. I come back to this point in more detail in Article 7.3.
Future stock market returns
Like bonds, future stock returns are also expected to be below historical averages as I discussed above. Also like bonds, whenever there is any news of potential interest rate increases, almost every media outlet publishes an article with a headline that says something like: “Stocks decline on speculation of Fed rates increase”. So, it might be reasonable to assume that stocks are also going to suffer greatly as interest rates continue to rise.
The Fed is projecting a base interest rate of around 0.25% to 0.75% through 2021. While history may not be a perfect mirror for the future, it’s worth looking at the history of stock returns and interest rate movements as shown in this graph from JP Morgan Asset Management.

Despite all the news articles, history shows that when the yield of the 10-year government bond is below 5%, stock returns tend to be positively correlated with increasing interest rates. While there will be short-term gyrations of stock prices when interest rates are raised, evidence suggests that there won’t be the systematic stock price declines that we expect with bonds.
Outside of interest rate rises, is there anything else special about our current situation that would likely impact the future of stocks? There are many international, economic, government policy, technology, and business factors (among a few) that could impact stock returns and risks in any given period. Nonetheless, it’s worth examining some of the most common measures used to judge future stock performance, which is exactly the type of measures that go into the future expected stock return models and calculations that I reviewed above.
One popular measure of future stock performance is to look at the current price-earnings (P/E) ratios. Here is one typical analysis from JP Morgan Asset Management. This is simply taking the stock price and dividing it by the annual earnings per share.

The forward-looking P/E for the S&P 500 was about 23 as of August 2020 when this chart was prepared. (“Forward-looking” means that the earnings estimates are based on analysts’ projections of stock earnings for the next year.
Forward P/Es can be tricky, because they are predictions themselves, and as we have seen, most predictions are highly uncertain. Here is another estimate of future stock returns from StarCapital Research that is based on the past rolling ten years of P/E ratios, known as the Shiller CAPE ratio.

As of September 2020, the S&P 500 CAPE ratio is at about 38, which is historically very high. So, using the yellow dots (S&P 500) in the graph above, we can see it’s unlikely that the next 10-15 years of stock returns (inflation-adjusted or “real” returns in this case) will be much higher than about 0%. As discussed above, these are only broad and highly uncertain estimates, and StarCapital Research estimated an overall uncertainty range from 11% to -1.5% real returns using the CAPE ratio from December 2015.
Attempting to predict stock returns in the next year, or even the next few years, is essentially an impossible exercise because stocks are so volatile and can react suddenly to myriad random events from around the world. The one thing we know for sure is that stocks will go down as well as up, although the overall trajectory will likely be upward over sufficiently long periods. This graph from JP Morgan Asset Management is a good reminder to expect the unexpected with stocks.

Even though average annual returns for stocks have been around 9 to 10% for the last century, this graph shows you can expect significant within-year declines to occur even in years that have very good year-end returns. The future of stocks is very likely to be the same roller coaster it has always been. One year that’s very good can be followed by another year that’s very bad, and every conceivable mixture of good and bad years will also occur. To sum up, although it’s pretty clear we should expect lower than historical average returns for stocks, there is little evidence for a strong downward force on stock returns due to potential interest rate increases that is anything like the bond situation.
Conclusions
Our conclusions about “what to invest in” based on a mindful assessment of historical and expected future returns and risks in Articles 6.1 and 6.2 include:
- Even given a wide range of potential future outcomes, it appears very likely that stocks will always provide substantially better returns than intermediate-term bonds.
- In the near future, stocks are the only option that has a reasonable prospect for keeping ahead of inflation and increasing the purchasing power of your money.
- Stocks may be less “risky” than commonly portrayed, particularly if they fit within your investing time horizons. (More on time horizons in Article 8.)
- History suggests that we live in a unique time with regards to bonds, which makes them more “risky” than commonly portrayed.
A mindful perspective also demands humility. These conclusions are based on history, which will never be repeated exactly. Likewise, predicting the future is notoriously difficult, particularly based on economic and financial models that are imperfect at best. It’s extremely important to not rely on any of these conclusions too heavily. Humility suggests that we cannot entirely ignore the traditional role of bonds in investment portfolios. Particularly if interest rates unexpectedly sky-rocket in the next few years, many of the dangers of bonds will diminish, and bonds could once again provide a reasonable balance of risk and returns. The appropriate mix of stocks and bonds (and cash) is discussed more in Article 7 on diversification.
Hi Karl,
As previously mentioned on our discussion on my blog: a great post you have here!
After reading your article I have a question, do you believe it is the risk premium in the stock market that has changed, or is the shift in expected stock return solely due to lower interest rate?
Thanks for taking the time to read this post and your thoughtful question. In answer to your question, I would say that neither a change in risk premium nor interest rates explain (at least directly) the lower expected stock returns moving forward. The direct cause that most of these estimates point to is high current valuations of stocks. All these models use the past predictive power of valuations (e.g., a PE or CAPE ratio) to make forward predictions. That is, stocks are just too darn expensive right now. If the stock market plunges by 50% tomorrow, then all these predictions will need to change for anyone investing after the time of the crash. You could make the case that lower interest rates are what’s driving folks to buy more stocks in hopes of getting a decent return. They are buying more stocks, because the returns on bonds (as I’ve noted in these posts) are really dismal in a low interest rate world. So, in that sense, I guess you could say that low interest rates are “causing” the future expected low returns for stocks. But stock valuation is still a more proximal explanation.
Amazing work! Thank You. Please update for 2019.
Thanks for the compliment. I last updated this in September of 2018, and some of these forecasts are issued around mid-year each year. So, I will likely update this again in late summer or fall of 2019.
I updated the expected return estimates in this article as of October 2019.
Awesome! Thank you for your hard work. I appreciate all the data. Keep the updates coming.
Much appreciated.
Great summary!
Karl- any updates? Love your website! I appreciate your work.
The article was updated with new forecasts in September 2020, as noted at the top of the article. I usually update this annually, because that’s how often most of these forecasts are issued. So, the next update won’t be until about this time next year. Thanks for reading.
Thank you.
Hello,
I asked a another webmaster on his website : https://etre-riche-et-independant.com/suivi-portefeuille-boursier-reporting-novembre-2020 ( it’s french, you can use google translate).
I showed him you website and your EXCEL file with forecasts. ( on the comment section )
He told me he doesn’t trust in : GMO, Research Affiliates, JP Morgan, AQR, Star Capital Research, Morgan Stanley, Morning Star, Charles Schwab, Vanguard, Blackrock, Buckingham SW, David Merkel, Last Years Robeco.
He told me they said European forecast would be better than USA forecast but that they were wrong in reality for the ten last years.
He told me the emerging market was risky because of money devaluating of the Bresil for example.
He chose 45% USA, 25% France, 24% Europe, 5% China. For him, USA big companies will perform well.
What do you think about it ? What is your current allocation ?
Thank you very much
I think I’m pretty clear in the article that all these forecasts have large uncertainties. I have used the phrase, “You can’t predict the future” perhaps more than any other on this website. So, I generally agree with your comment.
But the purpose of reviewing these forecasts is to help make reasonable return assumptions in our investing plans. So, for your own plan, you can assume (for example) that U.S. stocks will perform consistent with historical average returns (about 9%). But I prefer to be cautious in my own planning and use these more pessimistic forecasts for U.S. stocks (about 5%). (In other words, if all the weather forecasts call for rain, it seems unwise to leave your raincoat at home.)
Finally, these forecasts are not useful for setting asset allocations. Instead, I view diversification as a good idea exactly because no one can predict which assets will perform best in the next decade or so. Consistent with this, my allocation is similar to a balanced all-world stock portfolio of 60% U.S., 25% developed markets ex-U.S., and 15% emerging markets.
Thanks for your comment.
Hi, Good Article.
Any research or forecasts you came across regarding weakening dollar? DM and EM equity held in USD will increase in value if dollar weakens. Are JPM and others already considering this in their forecasts?
I haven’t collected any forecasts for currencies. I suspect that some of the models used for stock and bond forecasts consider currency valuation expectations, but I haven’t looked at that in detail. You can download my summary spreadsheet, which has links to all the forecast sources. Most of these sources explain their models to some extent. So, you might find some relevant information that way.